Living Data
2020 Collaborations

Disclaimers, Copyrights and Citations
Seeding treaties/ collaborations Index 2019 2020


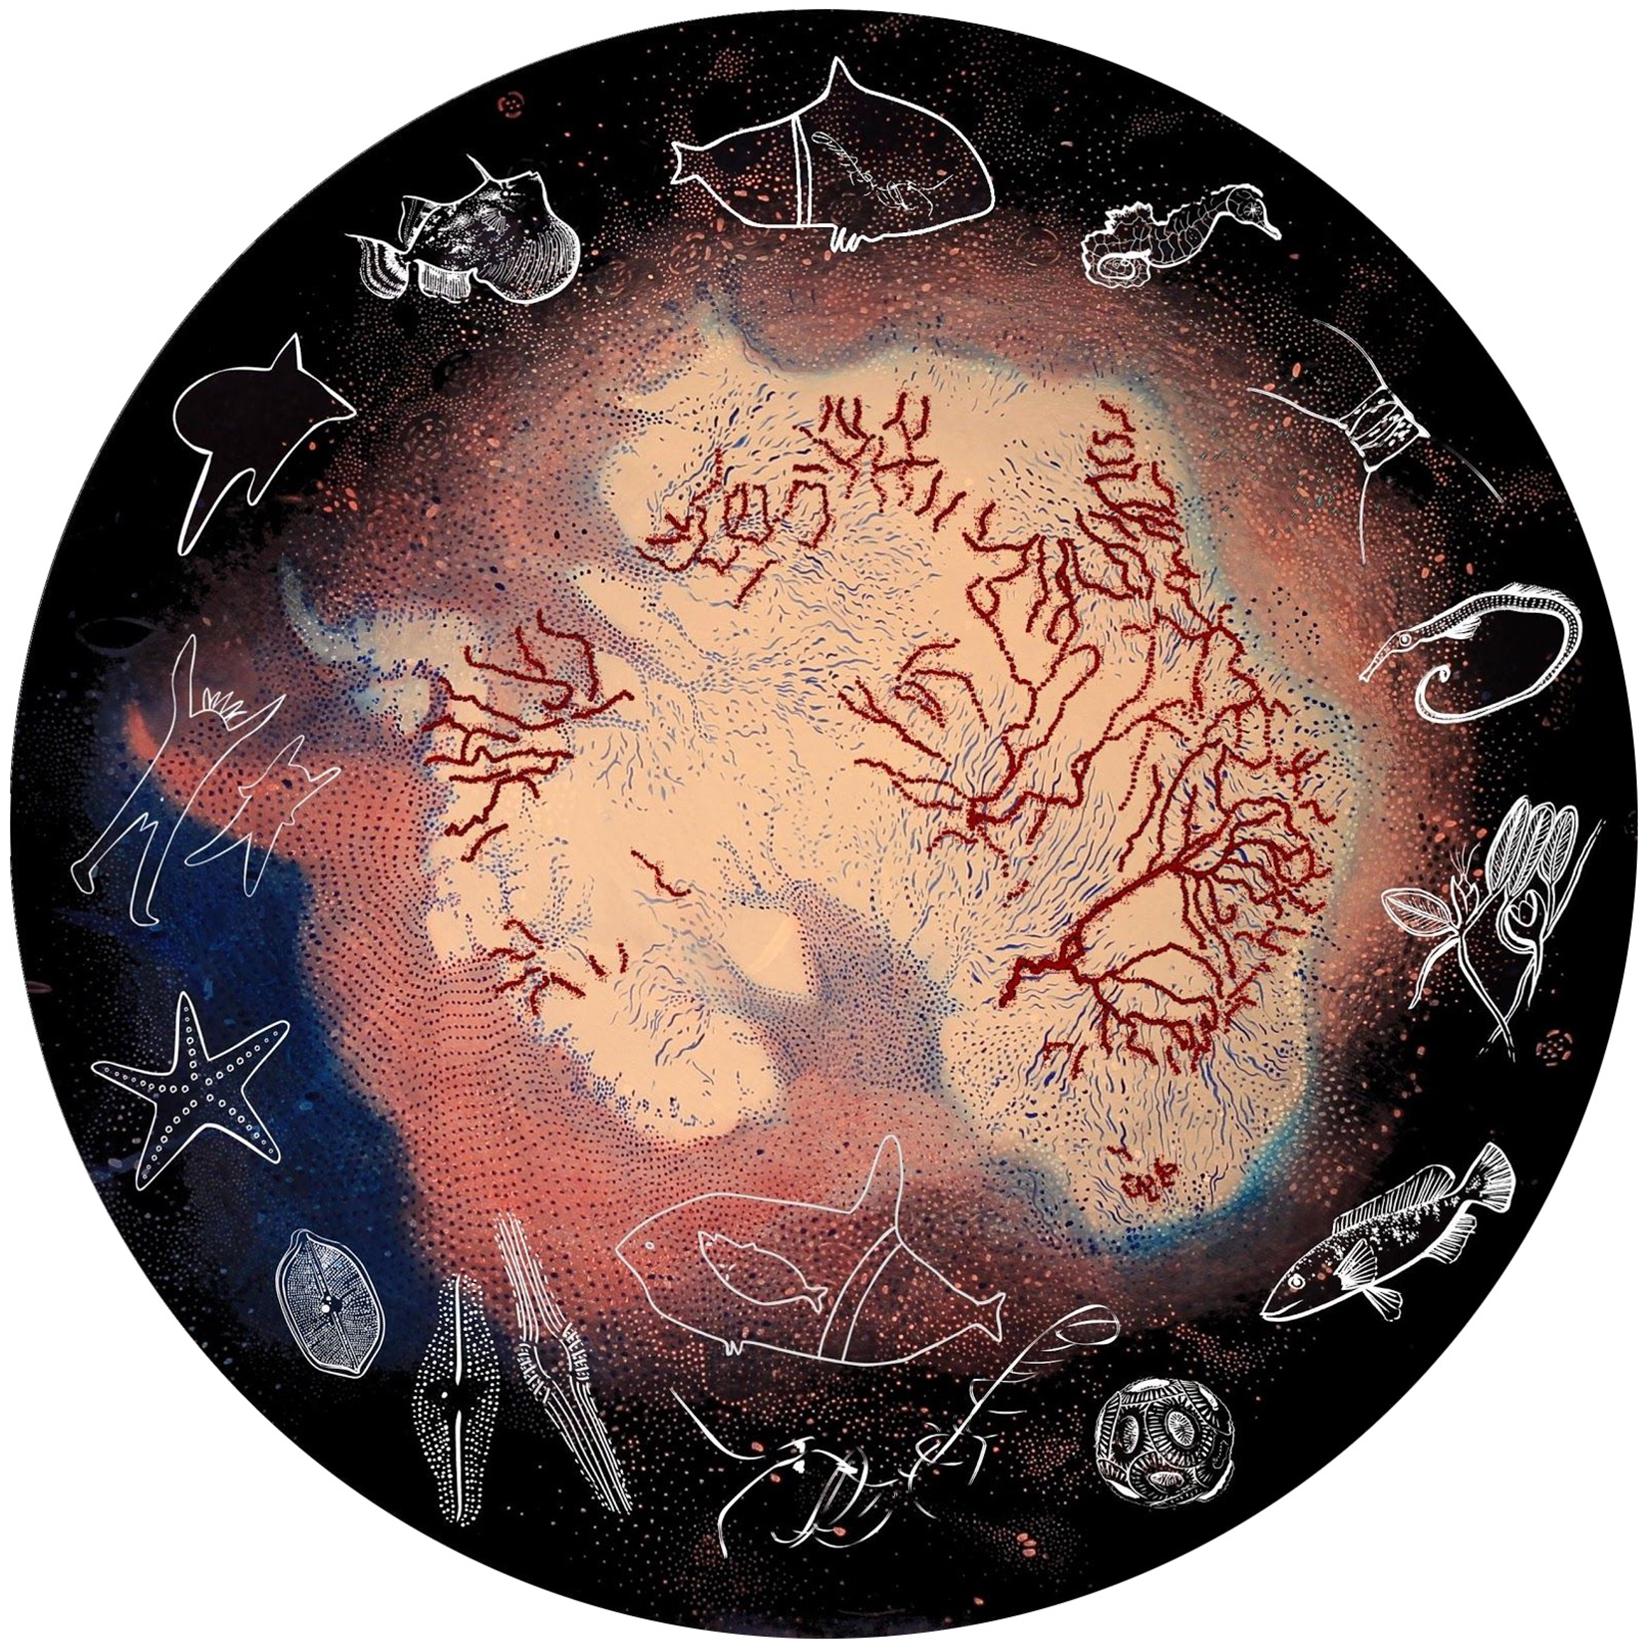
This is a screen shot of the Animated Interactive Map of Circumpolar Connections.
Icons indicate methods used to tell stories, and link to publications, videos and animations.
This screen shot was accessed Thursday 1 October 2020.
Link here to the Animated Interactive Map.